Setup
Method: Mixture cure models with age and year as continuous covariables
In the following models, we assumed a non-linear effect of age at diagnosis both on the survival probability for the uncured and on the probability of cure. However, for the year of diagnosis, we fitted 4 models, which vary depending on linear or non-linear effect assumed for the year of diagnosis on either the survival probability of the uncured or the probability of cure.
We fit the following models, with \(S(t;\mathbf{x})=\pi(\mathbf{x}) + (1-\pi(\mathbf{x}))S_u(t;\mathbf{x})\), where \(\pi(\mathbf{x})\) is the probability of cure and \(S_u(t;\mathbf{x})\) is the survival of the uncured.
We assumed a Weibull distribution for the uncured, \(S_u(t;\mathbf{x})=\exp(-\lambda(\mathbf{x})t^\kappa)\) , where \(\lambda\) is the scale and \(\kappa\) is the shape parameter, and we assumed a logit parametrisation for the cure probability, \(\pi(\mathbf{x})=\frac{\exp(\mathbf{x}\mathbf{\beta})}{1+\exp(\mathbf{x}\mathbf{\beta})}\). The matrix \(\mathbf{x}\) represents the age at diagnosis and the year of diagnosis.
Mod.Fixed.mixcure_2X <- optim(par=rep(0.1, 15), fn=Tot.LogLik.mixcure_2X, hessian=T, method = "BFGS",
                              Time=mydat$timesurv15y, Status = mydat$vstat15y, varyear=mydat$ydiagcr,
                              varage=mydat$agediagcr, control=list(maxit=10000))
Mod.Fixed.mixcure_2X$convergence
## [1] 0Mod.Fixed.mixcure_2X.SuYLin <- optim(par=rep(0.1, 13), fn=Tot.LogLik.mixcure_2X, hessian=T, method = "BFGS",
Time=mydat$timesurv15y, Status = mydat$vstat15y, varyear=mydat$ydiagcr,
varage=mydat$agediagcr, control=list(maxit=10000), ModForm="SuYLin")
Mod.Fixed.mixcure_2X.SuYLin$convergence## [1] 0# Akaike Information Criteria
print("Both Non linear:")## [1] "Both Non linear:"2*Mod.Fixed.mixcure_2X$value+2*length(Mod.Fixed.mixcure_2X$par)## [1] 1912.64print("Su with linear effect of year")## [1] "Su with linear effect of year"2*Mod.Fixed.mixcure_2X.SuYLin$value+2*length(Mod.Fixed.mixcure_2X.SuYLin$par)## [1] 1910.75ModFinal <- Mod.Fixed.mixcure_2X.SuYLinResults
expit <- function(x){exp(x)/(1+exp(x))}
theagediag=seq(0,24,by=0.1); myagediagcr=(theagediag-agediagk)/10 # corresponds to mydat$agediagc/10
linpredage <- ModFinal$par[c(2,6:8)]%*%rbind(1,myagediagcr, myagediagcr^2, (myagediagcr^2)*(myagediagcr>0))
myt <- seq(0,15,by=0.1)
kap <- ModFinal$par[1]
alpha0 <- ModFinal$par[2]
alpha1 <- ModFinal$par[3]
alpha2 <- ModFinal$par[4]
alpha3 <- ModFinal$par[5]
alpha4 <- ModFinal$par[6]
alpha5 <- ModFinal$par[7]
alpha6 <- ModFinal$par[8]
beta0 <- ModFinal$par[9]
beta1 <- ModFinal$par[10]
beta4 <- ModFinal$par[11]
beta5 <- ModFinal$par[12]
beta6 <- ModFinal$par[13]
myvarcov <- solve(ModFinal$hessian)
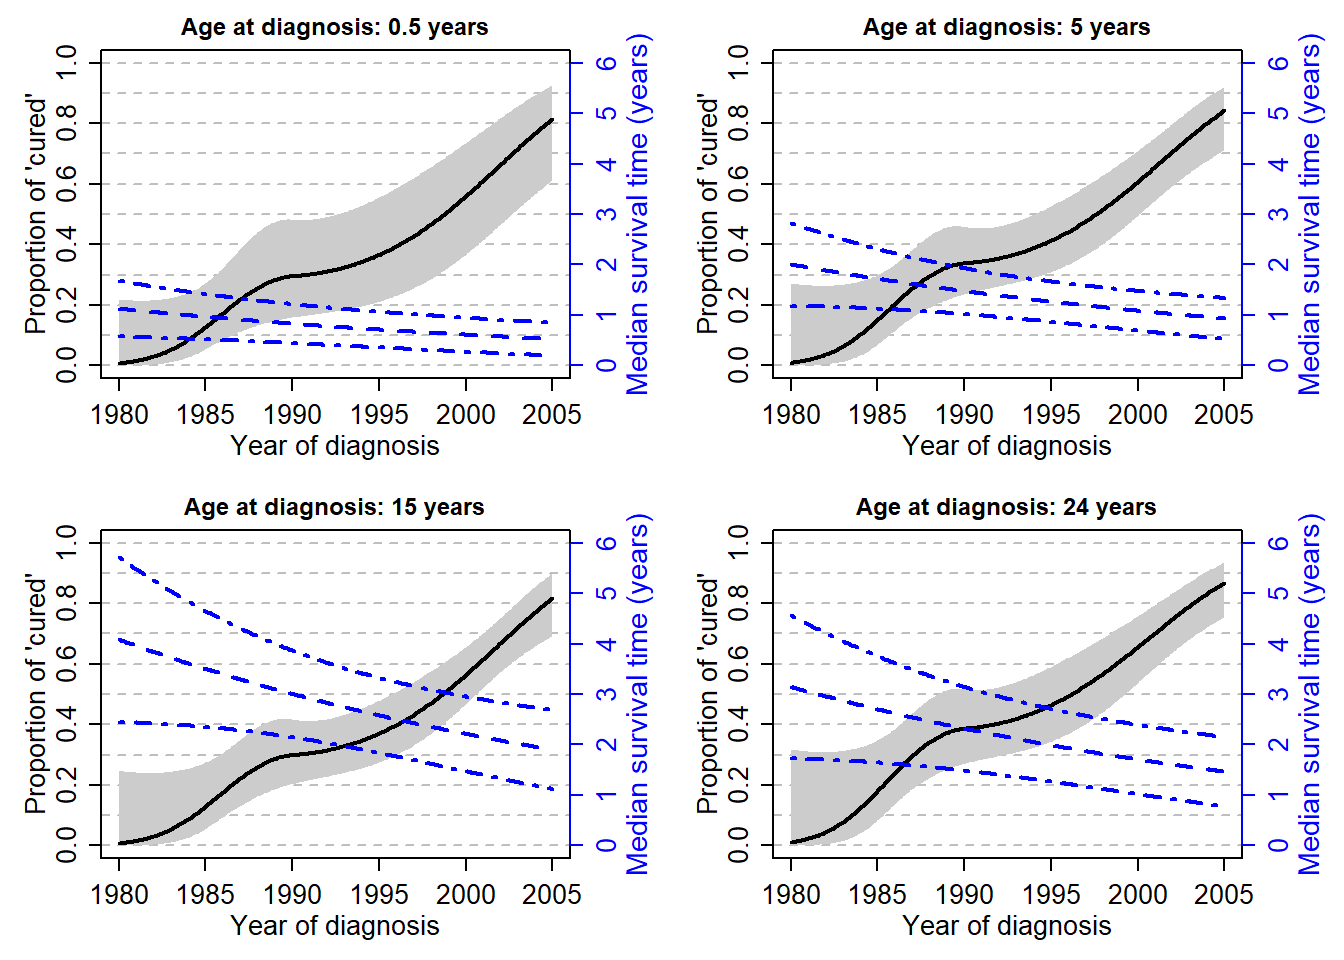
stdErr <- sqrt(diag(myvarcov))Trends of Median Survival Time of the Uncured and of the probability of cure, by age
# Median survival Time: percentile=0.5

par(mfrow=c(2,2), mex=0.8, mgp=c(2,0.8,0))

for (ageplot in c(0.5, 5, 15, 24)){
  perc=0.5
  theagediag=ageplot;

ResTmed<-ResTmedLB<-ResTmedUB<-NULL
yy<-seq(1980,yearmax,0.1)

for (ii in yy){
  theyeardiag=ii; k=kap;
  theb=c(beta0, beta1, beta4, beta5, beta6)
  myagediagcr=(theagediag-agediagk)/10; myyeadiagcr=(theyeardiag-ydiagk)/10;
  thecovariate=c(1, myyeadiagcr, myagediagcr, myagediagcr^2, (myagediagcr^2)*(myagediagcr>0))
  (linpredTmed <- t(theb)%*%thecovariate)
  (Tmed<-(-log(perc)/(exp(linpredTmed)))^(1/k))

  # Partial derivative (based on https://www.derivative-calculator.net/)
  dfdkap <- ((-log(perc))^(1/k)*(linpredTmed-log(-log(perc)))*exp((-linpredTmed)/k))/k^2
        # dfdalpha0 <- -((-log(p))^(1/k)*exp((-linpredTmed)/k))/k
        # dfdalpha1 <- -((-log(p))^(1/k)*y_1*exp((-linpredTmed)/k))/k
        # dfdalpha2 <- -((-log(p))^(1/k)*y_2*exp((-linpredTmed)/k))/k
  PartDer <- c(dfdkap, c(-((-log(perc))^(1/k)*exp((-linpredTmed)/k)))/k*thecovariate)
  varTmed <- t(PartDer) %*% myvarcov[c(1,9:13),c(1,9:13)] %*% PartDer
  seTmed<-sqrt(varTmed)

  TmedLB<-Tmed-qnorm(0.975)*seTmed; TmedUB<-Tmed+qnorm(0.975)*seTmed;

  ResTmed<-c(ResTmed, Tmed); ResTmedLB<-c(ResTmedLB, TmedLB); ResTmedUB<-c(ResTmedUB, TmedUB);
  }


par(mar=c(4,4,2,4))
# Plot of the probability to be cured according to year, for different ages
plot(0,0,type="n", xlim=c(1980,yearmax), ylim=c(0,1), xlab="Year of diagnosis", ylab="Proportion of 'cured'",
     panel.first=abline(h=seq(0,1,by=0.1), lty=8, col="grey"),
     main=paste0("Age at diagnosis: ", ageplot, " years"), cex.main=0.9)

myprob<-myprobLB<-myprobUB<-NULL
  myagediagcr=(theagediag-agediagk)/10 # corresponds to mydat$agediagc/10
  for (ii in (seq(1980,yearmax,0.1)-ydiagk)/10){
    myvec<-c(1, ii, ii^2, (ii^2)*(ii>0), myagediagcr, myagediagcr^2, (myagediagcr^2)*(myagediagcr>0))
    linpred <- ModFinal$par[2:8]%*%myvec
    selinpred <-  sqrt(t(myvec)%*% myvarcov[c(2:8),c(2:8)] %*% myvec)

    myprob <- cbind(myprob, expit(linpred))
    myprobLB <- cbind(myprobLB, expit(linpred+qnorm(0.025)*selinpred))
    myprobUB <- cbind(myprobUB, expit(linpred+qnorm(0.975)*selinpred))
    }

  polygon(c(seq(1980,yearmax,0.1) ,rev(seq(1980,yearmax,0.1))),
          c(myprobLB, rev(myprobUB)), col=grey(0.8),border=NA)
  lines(seq(1980,yearmax,0.1), myprob, type="l", lwd=2)

par(new=T)

plot(yy, ResTmed, type="l", lwd=2, lty=2, axes=F, xlab=NA, ylab=NA,
     ylim=c(0,6), col.lab="blue", col="blue")
lines(yy, ResTmedLB, lty=4, lwd=2, col="blue")
lines(yy, ResTmedUB, lty=4, lwd=2, col="blue")
axis(side=4, col.ticks="blue", col="blue", col.axis="blue")
mtext(side=4, line=2, "Median survival time (years)", col="blue", cex=0.9)
}
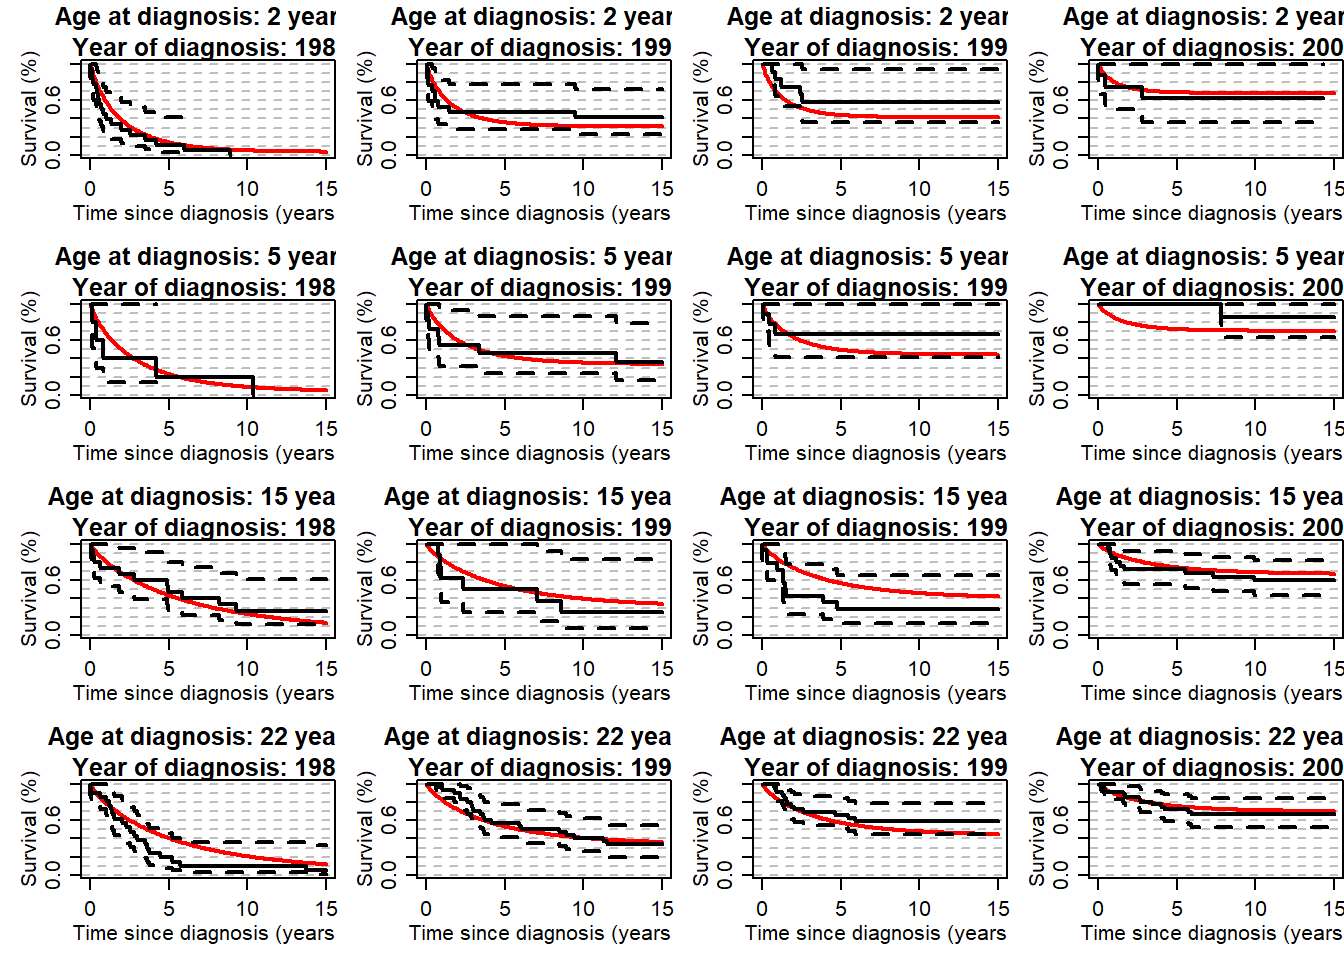
myt <- seq(0,15,by=0.1)

par(mfrow=c(4,4), mex=0.8, mgp=c(2,0.8,0), mar=c(4,4,3,0))
for (ageplot in c(2, 5, 15, 22)){
  theagecr <- (ageplot-agediagk)/10
  for (yy in c(1982, 1990, 1996, 2002)){
  theyearcr <- (yy-ydiagk)/10
  myp <- exp(alpha0 + alpha1*theyearcr + alpha2*theyearcr^2 + alpha3*theyearcr^2*(theyearcr>0) +
               alpha4*theagecr + alpha5*theagecr^2 + alpha6*theagecr^2*(theagecr>0))
  py <- myp/(1+myp)
  myoverS<- py+(1-py)*St_Weib_2X(t=myt, varyear=theyearcr, varage=theagecr, kap=kap,
                                 beta0=beta0, beta1=beta1, beta2=0, beta3=0, beta4=beta4, beta5=beta5, beta6=beta6)
  plot(myt, myoverS, type="l", xlab="Time since diagnosis (years)", ylab="Survival (%)", ylim=c(0,1), lwd=2,
       panel.first=abline(h=seq(0,1,by=0.1), lty=8, col="grey"),
       main=paste0("Age at diagnosis: ", ageplot, " years \n Year of diagnosis: ", yy), col="red")

  temp1 <- subset(mydat, agediag>=ageplot-2 & agediag<=ageplot+2 & ydiag>=(yy-2) & ydiag <=(yy+2))
  lines(survfit(Surv(timesurv15y, vstat15y)~1,data=temp1), lwd=2)
}
}
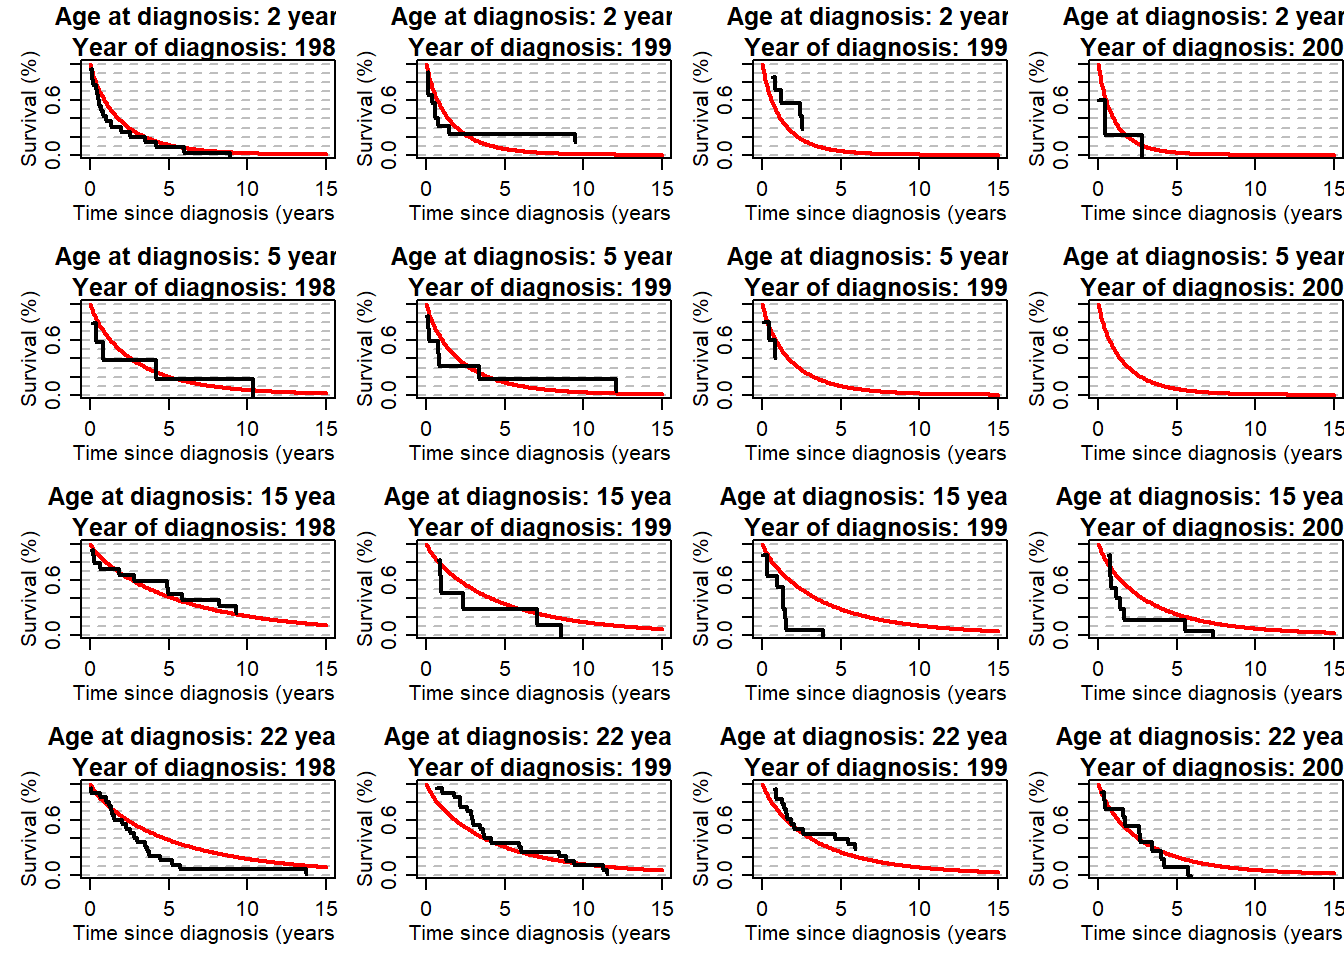
## checking the quality of fit of the uncured
myt <- seq(0,15,by=0.1)

par(mfrow=c(4,4), mex=0.8, mgp=c(2,0.8,0), mar=c(4,4,3,0))
for (ageplot in c(2, 5, 15, 22)){
  theagecr <- (ageplot-agediagk)/10
  for (yy in c(1982, 1990, 1996, 2002)){
  theyearcr <- (yy-ydiagk)/10
  myp <- exp(alpha0 + alpha1*theyearcr + alpha2*theyearcr^2 + alpha3*theyearcr^2*(theyearcr>0) +
               alpha4*theagecr + alpha5*theagecr^2 + alpha6*theagecr^2*(theagecr>0))
  py <- myp/(1+myp)
  myUncurS<- St_Weib_2X(t=myt, varyear=theyearcr, varage=theagecr, kap=kap,
                                 beta0=beta0, beta1=beta1, beta2=0, beta3=0, beta4=beta4, beta5=beta5, beta6=beta6)
  plot(myt, myUncurS, type="l", xlab="Time since diagnosis (years)", ylab="Survival (%)", ylim=c(0,1), lwd=2,
       panel.first=abline(h=seq(0,1,by=0.1), lty=8, col="grey"),
       main=paste0("Age at diagnosis: ", ageplot, " years \n Year of diagnosis: ", yy), col="red")
  temp1 <- subset(mydat, agediag>=ageplot-2 & agediag<=ageplot+2 & ydiag>=(yy-2) & ydiag <=(yy+2))
  toplot <- data.frame(time=summary(survfit(Surv(timesurv15y, vstat15y)~1,data=temp1))$time,
                     surv=(summary(survfit(Surv(timesurv15y, vstat15y)~1,data=temp1))$surv-py)/(1-py))
  lines(toplot$time, toplot$surv, type="s", lwd=2)
}
}
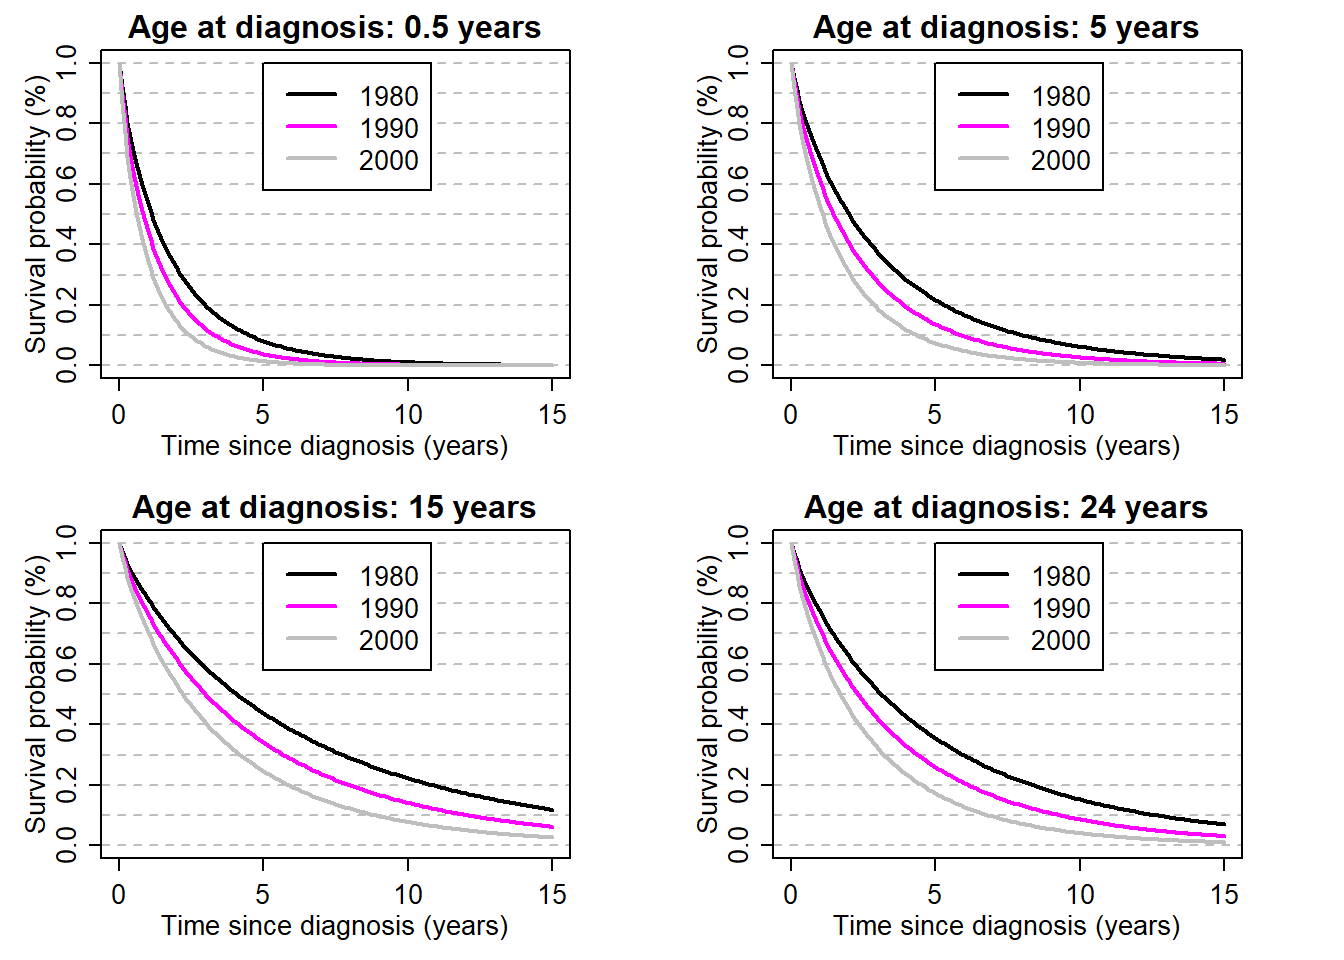
myt <- seq(0,15,by=0.1)

par(mfrow=c(2,2), mex=0.8, mgp=c(2,0.8,0), mar=c(4,4,2,4))
for (ageplot in c(0.5, 5, 15, 24)){
  theagecr <- (ageplot-agediagk)/10
  for (yy in c(1980,1990,2000)){
  theyearcr <- (yy-ydiagk)/10
  lambda <- exp(beta0+beta1*theyearcr+
                  beta4*theagecr+beta5*theagecr^2+beta6*theagecr^2*(theagecr>0))
  mys <- exp(-lambda*myt^kap)
  if (yy==1980){plot(myt, mys, type="l", xlab="Time since diagnosis (years)", ylab="Survival probability (%)", lwd=2, ylim=c(0,1),
                     panel.first=abline(h=seq(0,1,by=0.1), lty=8, col="grey"),
                     main=paste0("Age at diagnosis: ", ageplot, " years"))}
  else points(myt, mys, type="l", xlab="years", ylab="Survival", col=yy, lwd=2)
  legend(x=5,y=1,c("1980","1990","2000"), lty=1, col=c(1,1990,2000), lwd=2)
  }
}