Background Describing the relationship between socio-economic inequalities and cancer survival is important but methodologically challenging. We propose guidelines for addressing these challenges and illustrate their implementation on French population-based data. Methods We analysed 17 cancers. Socio-economic deprivation was measured by an ecological measure, the European Deprivation Index (EDI). The Excess Mortality Hazard (EMH), i.e. the mortality hazard among cancer patients after accounting for other-causes of death, was modelled using a flexible parametric model, allowing for non-linear and/or time-dependent association between the EDI and the EMH. The model included a cluster-specific random effect to deal with the hierarchical structure of the data. Results We reported the conventional age-standardized net survival (ASNS), and we described the changes of the EMH over the time since diagnosis at different levels of deprivation. We illustrated non-linear and/or time-dependent associations between the EDI and the EMH by plotting the excess hazard ratio according to EDI values at different times after diagnosis. The Median Excess Hazard Ratio quantified the general contextual effect. Lip-Oral-Cavity-Pharynx cancer in men showed the widest deprivation gap, with 5-year age-standardized net survival at 41% and 29% for deprivation quintiles 1 and 5, respectively and we found a non-linear association between the EDI and the EMH. The EDI accounted for a substantial part of the general contextual effect on the EMH. The association between the EDI and the EMH was time-dependent in stomach and pancreas cancers in men and in cervix cancer. Conclusion The methodological guidelines proved efficient in describing the way socio-economic inequalities influence cancer survival. Their use would allow comparisons between different healthcare systems.
Summary of the guidelines
DATA
- Use data from a source that provides an unbiased picture of the whole population, such as population-based registries data
- Use an appropriate ecological deprivation measure, which can be (i) replicated in other countries (for comparison purposes); and, (ii) based on as small geographical unit as possible
METHOD
- Define the excess mortality hazard as your main quantity of interest
- Use general population lifetables for the expected mortality hazard, and the deprivation-specific ones whenever possible
- Use flexible parametric multivariable regression models, which enable modelling non-linear as well as time-dependent log Excess Hazard Ratios for prognostic factors (such as the deprivation index)
- Take account of the multilevel/hierarchical structure of the data to derive correct statistical inference
- Use a model-building strategy or an information criterion to eliminate spurious non-linear and time-dependent log Excess Hazard Ratios
RESULTS
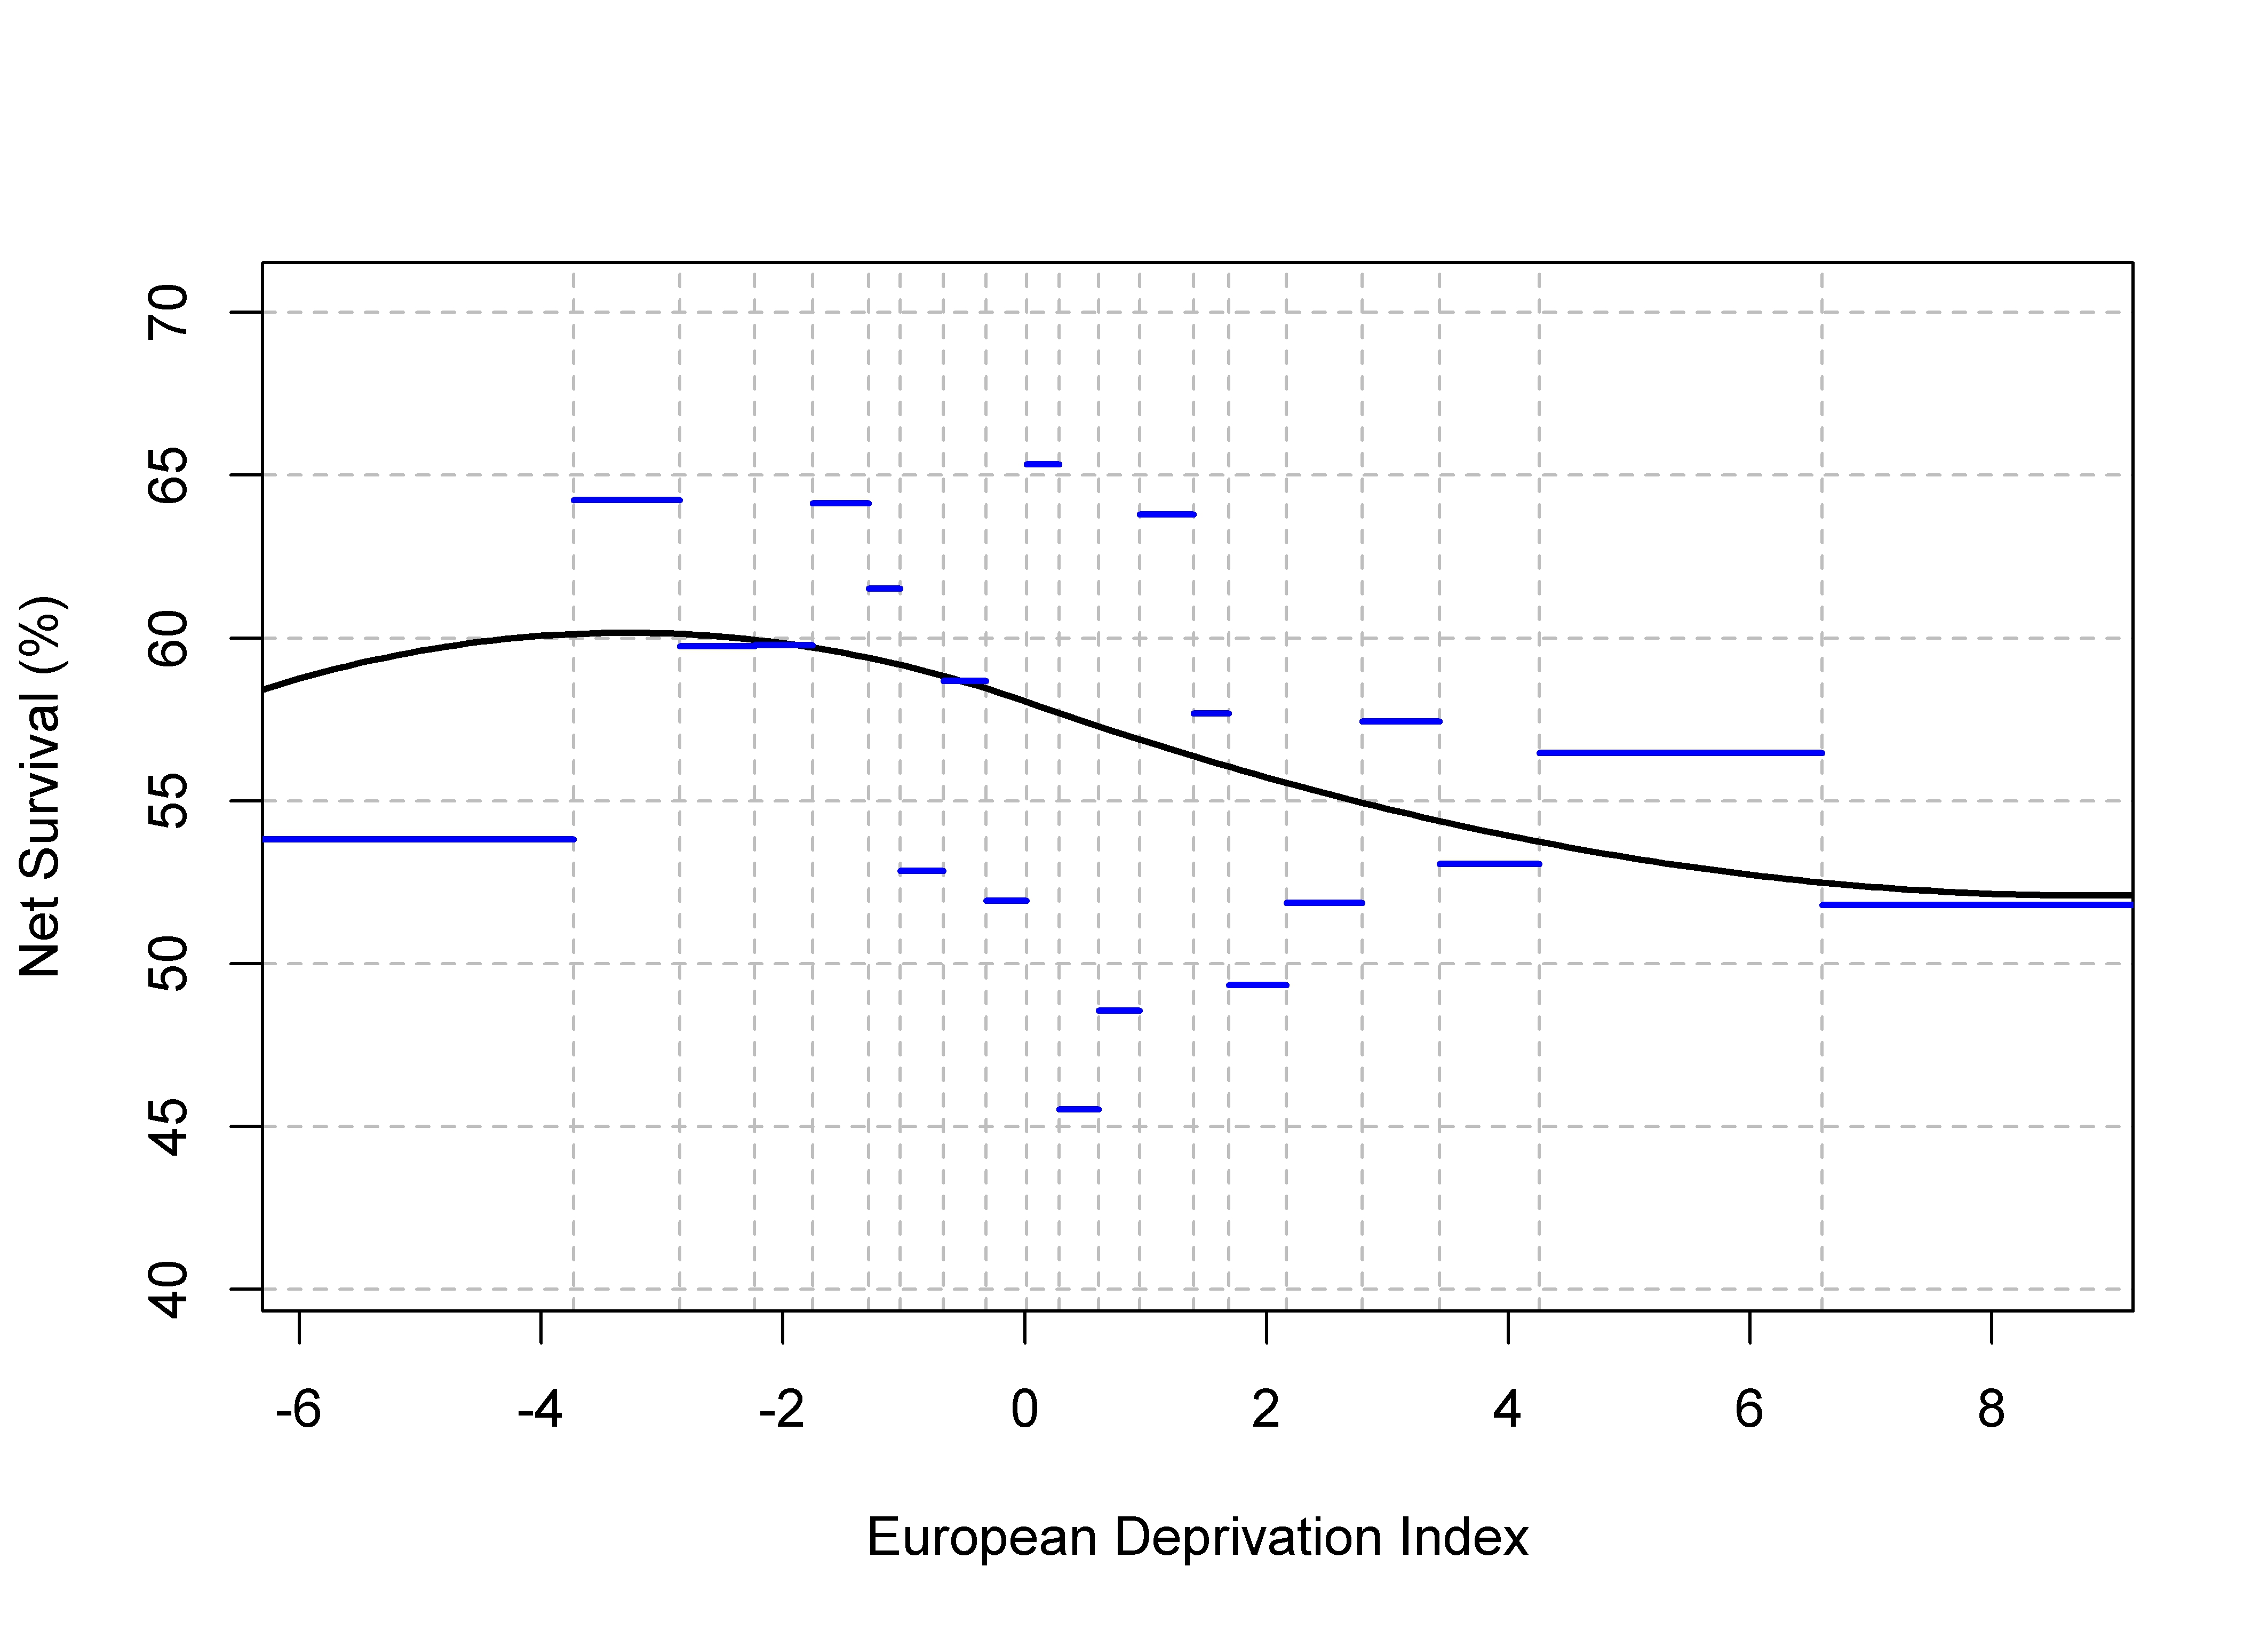
- Provide model-predicted age-standardised net survivals by deprivation quintile and compare them to the non-parametric estimates (to check the goodness-of-fit of the model)
- Give additional and clinically relevant information from the modelling approach: (i) the change with time since diagnosis of the excess mortality hazard for different values of the deprivation index; and, (ii) the Excess Hazard Ratios for the association (eventually non-linear and/or time-dependent) between the EDI and the excess mortality hazard
- Quantify the impact of clustering on the excess mortality hazard using the General Contextual Effect and (whenever possible) an intra-class correlation coefficient